Fundamentals of Machine Learning
3. Regression
You are probably familiar with the idea of regression from math class. To sum it up, regression is a type of supervised learning that involves making continuous predictions on quantitative data.. Regression models can be used to infer a causal relationship between two variables or to predict and forecast new values.
Basic Regression
Let’s begin with a type of regression you are likely familiar with: linear regression. In linear regression, the data is preprocessed and labeled with the correct output. Linear regression can be defined by the relationship y=wx+b where w=weights (slope), b=bias (y-intercept).
The goal of regression is to minimize error. Error is defined as the distance between the actual value and the predicted value. The goal would be to minimize the sum of the squares of the errors. The type of linear regression (line of best fit) that you see at school has the same goal of minimizing the sum of the squares of the distances between actual and predicted. Points farther away are penalized significantly because the distance is squared. This is also known as Ordinary Least Squares (OLS) Estimation.
Linear regression is not always just a straight line. The weights and bias of a linear regression model can vary over time leading to complex linear regression models such as the one below.

When building a linear regression model, you must make the following assumptions:
No Multicollinearity: Multicollinearity is the occurrence of a high correlation between two or more independent variables in the regression model. Reduces the significance of the correlation between independent and dependent variables. Assumed no multicollinearity between independent variables.
Homoscedasticity (same variance): Variance should be similar among all values of independent variables, important because linear regressions are easily susceptible to outliers
Normal Distribution of Error: Confidence intervals may become too wide or narrow if error terms are non-normally distributed. Hard to estimate coefficients for a model with a confidence interval that is unstable.
What happens if a linear model cannot fit your data? That’s where nonlinear models come into play. Common examples include logarithmic regression and parametric regression.
Evaluating Performance
After building a basic regression model, you must have a way to check its performance. Here are the common forms of evaluation of linear regression data:
- R-squared: represents the proportion of variance for a dependent variable explained by the independent variable, bigger |R| means higher correlation.
- Adjusted R-Squared: modified R-squared that depends on a number of predictors. If a new variable that is significant is added, the adjusted R-squared will increase, if the variable doesn’t matter, it will stay the same.
- Root-mean-square-error (RMSE): calculated as the square root of the mean of the squared differences between actual outcomes and predictions, lower error is better.
When building regression models, it is also important to consider the bias and variance. Bias is the difference between predictions and actual values. High bias means a model is overgeneralizing and will perform poorly on new data. Variance is the spread of the data. High variance means the model pays too much attention to training data and overfits. When developing regression models, it is important to establish a bias/variance tradeoff.
Overfitting and Underfitting
It is also important to consider if a model is overfitting or underfitting. This can be done by analyzing performance on the training and test data set. Good models should have similar accuracies in the training and test set. Overfitting is where a machine learning model cannot generalize well to an unknown dataset, it fits training data too well. Underfitting is when there is poor performance on training and testing datasets.

How can we address overfitting in a regression model? One option is that we can drop unimportant variables from the dataset to reduce noise. Alternatively, we can perform regularization where instead of dropping variables, you just reduce the importance of insignificant variables. Regularization works better in larger datasets.
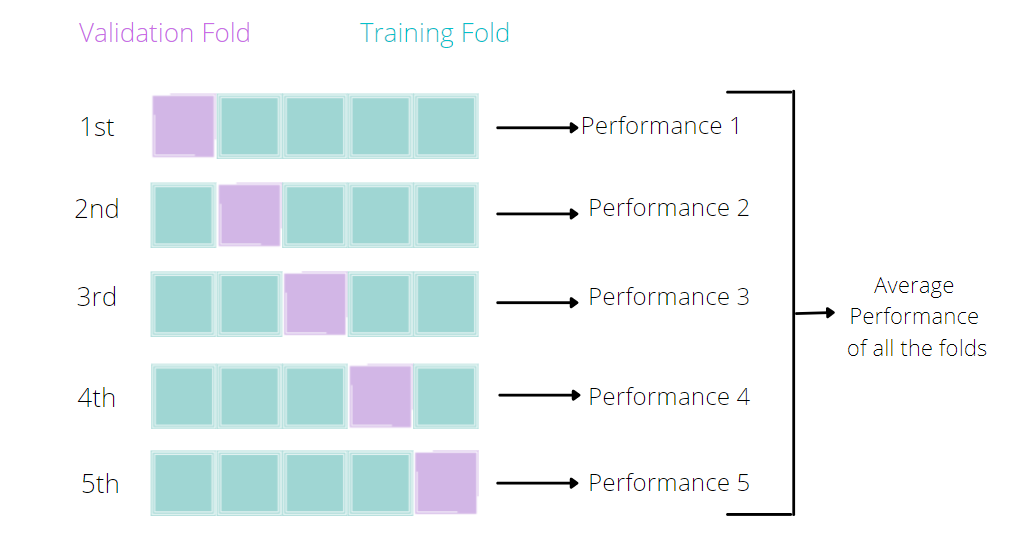
The analysis of training vs testing accuracy is called cross-validation. Within cross-validation, there is a type called K-fold cross-validation. In K-fold cross-validation, you would randomly divide data into n groups and use one of the groups as validation and the rest as training, repeating this process for every group.
Forecasting
Forecasting is the application of regression methods to time-series data. Essentially, you would be using past data to predict future data. Relevant applications include predicting trends in weather, the pandemic, and the stock market.